Building a Disk Space Monitoring Dashboard

Introduction
Running out of disk space can crash your system at the worst possible moment. A simple monitoring dashboard can save you from that chaos.
In this tutorial, I will walk you step-by-step through building a real-time disk space monitoring dashboard with Python, using FastAPI for the backend, Chart.js for visuals, and SSH for secure server access.
This approach provides a lightweight alternative to heavier monitoring solutions while giving you full control over the implementation.
Prerequisites
Before starting, here’s what you’ll need (don’t worry if you’re missing a few—jump in anyway!):
| What You Need | Why It Matters |
|---|---|
| Python 3.13+ | Powers the backend with the latest features, though earlier versions can work. |
| Linux server with SSH access | Provides the system to monitor and a secure connection for data retrieval. |
| SSH private key authentication | Ensures secure, automated access to the server without passwords. |
| Basic Linux filesystem commands (df, du, find, iostat) | Lets you understand and interact with the server’s disk usage metrics. |
| Familiarity with Python and async programming | Enables you to follow the asynchronous FastAPI code effectively. |
| Understanding of FastAPI fundamentals | Critical for building and customizing the API backbone of the dashboard. |
| Basic HTML, CSS, and JavaScript | Necessary for crafting and styling the frontend interface. |
| A code editor (e.g., PyCharm, VSCode) | Your tool for writing and debugging the code—any editor works. |
| Terminal access | Allows you to run commands, set up the environment, and launch the app. |
By the end of this article, you'll have a functioning dashboard that displays: - Disk space usage - Inode consumption metrics (inode explainer here) - Large file identification - Disk I/O statistics
Let's get started!
Architecture overview
The solution uses a client-server architecture with these components:
- Backend (FastAPI): Handles API requests, connects to servers via SSH, executes Linux commands, and parses results.
- Frontend (HTML/JS/Chart.js): Displays visualizations of the metrics through charts and tables.
- Data Collection: Uses paramiko library to establish SSH connections and execute commands on remote servers.
- Data Flow:
- Browser makes API requests to the FastAPI backend
- Backend connects to server via SSH, executes commands
- Results are parsed and returned as JSON
- Frontend renders the data with Chart.js
This architecture is lightweight but enough to get started, requiring no agents to be installed on monitored servers. The tradeoff is that it requires SSH access and creates a new connection for each request, which does not scale well for monitoring many servers simultaneously or adding new features.
Grab your coffee, coding time!
Prepare the Dev Environment
Fire up a virtual environment, I assume you know the basics but if you are new to virtual environments, check Python’s official docs for a quick setup guide.
mkdir monitoring
cd monitoring
python -m venv .venv
source .venv/bin/activate
Install the required Python packages. Create a requirements.txt with the following:
# requirements.txt
fastapi[standard]
paramiko
pytest
python-decouple
Then install them.
pip install --upgrade pip
pip install -r requirements.txt
python-decouple is used for loading the .env variables (I like this package very much)
Project files structure
ops_tools_examples/
├── .venv/  # The virtual environment
├── dashboard/   # The actual app home folder
│   ├── static/
│   │   ├── js/
│   │   │   └── dashboard.js
│   ├── templates/
│   │   └── index.html
│   ├── tests/
│   │   ├── __init__.py
│   │   └── test_app.py
│   ├── __init__.py
│   └── main.py
├── .env
├── .gitignore
└── requirements.txt
Now that we have setup the environment, let’s dive into setting up the backbone of our monitoring system!
Creating the Core Application
FastAPI will serve as our backend API that will serve the data to the frontend:
# dashbord/main.py
from pathlib import Path

from fastapi import FastAPI, Request
from fastapi.responses import HTMLResponse
from fastapi.templating import Jinja2Templates
from fastapi.staticfiles import StaticFiles
import paramiko
from typing import List

from decouple import AutoConfig
from pydantic.dataclasses import dataclass

BASE_DIR: Path = Path(__file__).resolve().parent
config = AutoConfig(search_path=BASE_DIR)

app = FastAPI(title="Linux Disk Space Monitor")
app.mount("/static", StaticFiles(directory=str(BASE_DIR / "static")), name="static")

templates = Jinja2Templates(directory="templates")

SERVER_CONFIG = {
    "hostname": config("HOSTNAME"),
    "port": config("PORT", default=22, cast=int),
    "username": config("USERNAME"),
}
Get the private key
key_type_mapping = {
    'ed25519': paramiko.Ed25519Key,
    'rsa': paramiko.RSAKey,
    'ecdsa': paramiko.ECDSAKey,
    'dss': paramiko.DSSKey
}

# Load the private key with information from .env
private_key_str = config("PRIVATE_KEY")
passphrase = config("PASSPHRASE", default=None)
key_type = config("PRIVATE_KEY_TYPE", default="ed25519").lower()
key_class = key_type_mapping.get(key_type)
Create the data models
Since we use FastAPI which uses pydantic behind the scene, we will create dataclasses to collect the data from the prompts. It can help for validation, IDE support and API documentation.
@dataclass
class DiskSpace:
    filesystem: str
    size: str
    used: str
    available: str
    use_percent: str
    mounted_on: str

@dataclass
class InodeUsage:
    filesystem: str
    inodes: str
    iused: str
    ifree: str
    iuse_percent: str
    mounted_on: str

@dataclass
class LargeFile:
    permissions: str
    owner: str
    group: str
    size: str
    date: str
    path: str

@dataclass
class DiskIO:
    device: str
    r_s: str = "0"
    w_s: str = "0"
    rkb_s: str = "0"
    wkb_s: str = "0"

    class Config:
        extra = "allow"  # Allow extra fields for flexibility with different iostat outputs
Connect and execute the commands
async def ssh_execute(command: str) -> str:
    """Execute a command on the remote server via SSH and return the output."""
    client = paramiko.SSHClient()
    client.set_missing_host_key_policy(paramiko.AutoAddPolicy())
    try:
        connection_params = {
            'hostname': SERVER_CONFIG['hostname'],
            'port': SERVER_CONFIG['port'],
            'username': SERVER_CONFIG['username'],
        }

        if private_key_str:
            print(f"Loading private key from file: {private_key_str}")
            try:
                if passphrase:
                    private_key = key_class.from_private_key_file(private_key_str, password=passphrase)
                else:
                    private_key = key_class.from_private_key_file(private_key_str)
                connection_params['pkey'] = private_key
            except Exception as key_error:
                    print(f"Failed to load private key from file: {key_error}")
        else:
            raise ValueError("Private key file not found")

        client.connect(**connection_params)
        stdin, stdout, stderr = client.exec_command(command)
        output = stdout.read().decode('utf-8')
        error = stderr.read().decode('utf-8')
        if error:
            print(f"Error executing {command}: {error}")
        return output
    except Exception as e:
        print(f"Error connecting to server: {e}")
        return f"Error: {e}"
    finally:
        client.close()
Build the API
Fetch the disk space information
@app.get("/api/disk-space", response_model=List[DiskSpace])
async def get_disk_space():
    """Get disk space information using df -h."""
    output = await ssh_execute('df -h')
    lines = output.strip().split('\n')
    data = []
    for line in lines[1:]:
        parts = line.split()
        if len(parts) >= 5:
            disk_space = DiskSpace(
                    filesystem=parts[0],
                    size=parts[1],
                    used=parts[2],
                    available=parts[3],
                    use_percent=parts[4],
                    mounted_on=parts[5] if len(parts) > 5 else ''
            )
            data.append(disk_space)

    return data
Fetch the inode information
@app.get("/api/inodes", response_model=List[InodeUsage])
async def get_inodes_usage():
    """Get inode usage information using df -i."""
    output = await ssh_execute('df -i')
    lines = output.strip().split('\n')
    data = []
    for line in lines[1:]:
        parts = line.split()
        if len(parts) >= 5:
            inode_usage = InodeUsage(
                filesystem=parts[0],
                inodes=parts[1],
                iused=parts[2],
                ifree=parts[3],
                iuse_percent=parts[4],
                mounted_on=parts[5] if len(parts) > 5 else ''
            )
            data.append(inode_usage)

    return data
Fetch the large files
@app.get("/api/large-files", response_model=List[LargeFile])
async def large_files():
    """Find large files over 50MB."""
    output = await ssh_execute('find / -type f -size +50M -exec ls -lh {} \\+ 2>/dev/null')
    lines = output.strip().split('\n')
    data = []
    for line in lines:
        if line:
            parts = line.split()
            if len(parts) >= 9:
                large_file = LargeFile(
                    permissions=parts[0],
                    owner=parts[2],
                    group=parts[3],
                    size=parts[4],
                    date=f"{parts[5]} {parts[6]} {parts[7]}",
                    path=' '.join(parts[8:])
                )
                data.append(large_file)

    return data
Fetch the disk I/O stats
@app.get("/api/disk-io", response_model=List[DiskIO])
async def disk_io():
    """Get disk I/O statistics."""
    try:
        output = await ssh_execute('iostat -d')
        if not output or "command not found" in output:
            return []

        lines = output.strip().split('\n')
        headers = None
        data = []
        in_device_section = False

        for line in lines:
            line = line.strip()
            if not line:
                continue

            # Skip the first line with kernel info
            if "Linux" in line:
                continue

            # Skip the CPU stats section
            if "avg-cpu" in line:
                continue

            # Get the headers of interest
            if "Device" in line:
                headers = line.split()
                in_device_section = True
                continue

            # Read the device stats
            if in_device_section:
                values = line.split()
                if len(values) >= 3:  # At minimum, we need device name and some stats

                    # Create a data object with column headers as keys
                    device_data = {"device": values[0]}

                    for i in range(1, min(len(headers), len(values))):
                        header_key = headers[i].lower()
                        device_data[header_key] = values[i]

                    # Ensure we have read and write rates for Chart.js
                    device_data['r_s'] = device_data.get('kb_read/s', "0")
                    device_data['w_s'] = device_data.get('kb_wrtn/s', "0")

                    disk_io_instance = DiskIO(**device_data)
                    data.append(disk_io_instance)

        return data
    except Exception as e:
        print(f"Error in disk_io endpoint: {e}")
        return [DiskIO(device="error", r_s="0", w_s="0")]
FastAPI Server Launcher
Finally this code checks if the script is being run directly (not imported), and if so, starts a Uvicorn web server to host the FastAPI application on all network interfaces at port 8000 with auto-reload enabled for development.
if __name__ == '__main__':
    import uvicorn
    uvicorn.run("dashboard.main:app", host="0.0.0.0", port=8000, reload=True)
You are halfway there! Next, the frontend!
Creating the Frontend
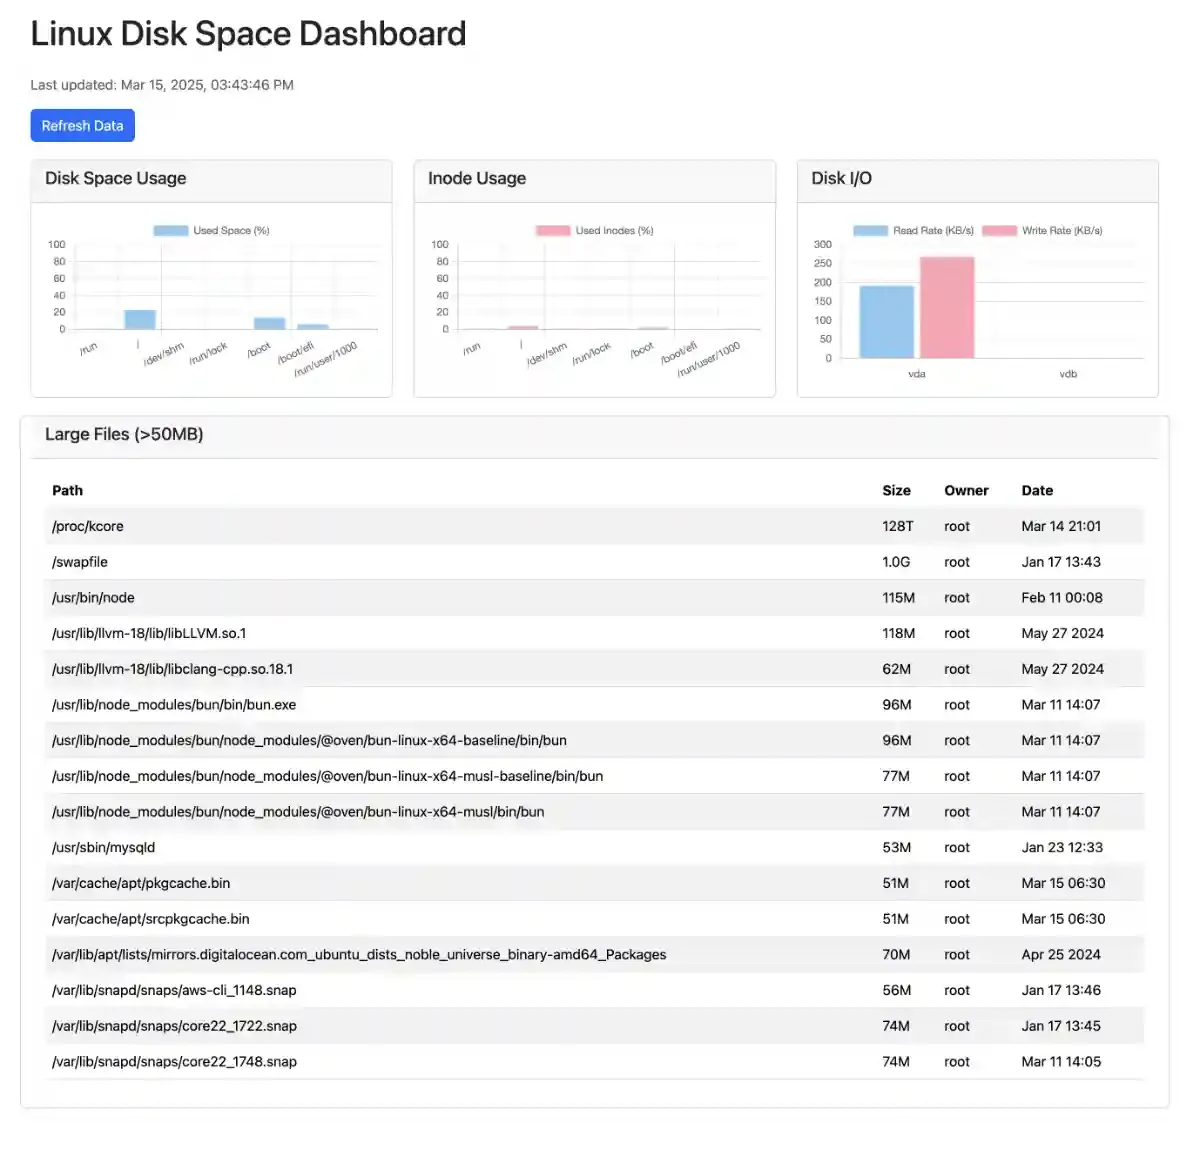
Now, let's create a simple HTML template with Bootstrap and some JavaScript to fetch and display the data. This is where the magic happens: your data comes to life in a clean, visual dashboard.
The template for index.html
<!-- templates/index.html -->
<!DOCTYPE html>
<html lang="en">
<head>
    <meta charset="UTF-8">
    <meta name="viewport" content="width=device-width, initial-scale=1.0">
    <title>Linux Disk Space Dashboard</title>
    <link href="https://cdn.jsdelivr.net/npm/bootstrap@5.3.3/dist/css/bootstrap.min.css" rel="stylesheet" integrity="sha384-QWTKZyjpPEjISv5WaRU9OFeRpok6YctnYmDr5pNlyT2bRjXh0JMhjY6hW+ALEwIH" crossorigin="anonymous">
    <style>
        .card {
            margin-bottom: 20px;
        }
        .refresh-btn {
            margin-bottom: 20px;
        }
    </style>
</head>
<body>
    <div class="container mt-4">
        <h1 class="mb-4">Linux Disk Space Dashboard</h1>
        <p id="lastUpdated" class="text-muted mb-3">Last updated: -</p>
        <button id="refreshBtn" class="btn btn-primary refresh-btn">Refresh Data</button>

        <div class="row">
            <div class="col-md-4">
                <div class="card">
                    <div class="card-header">
                        <h5>Disk Space Usage</h5>
                    </div>
                    <div class="card-body">
                        <canvas id="diskSpaceChart"></canvas>
                    </div>
                </div>
            </div>

            <div class="col-md-4">
                <div class="card">
                    <div class="card-header">
                        <h5>Inode Usage</h5>
                    </div>
                    <div class="card-body">
                        <canvas id="inodeChart"></canvas>
                    </div>
                </div>
            </div>

            <div class="col-md-4">
                <div class="card">
                    <div class="card-header">
                        <h5>Disk I/O</h5>
                    </div>
                    <div class="card-body">
                        <canvas id="diskIOChart"></canvas>
                    </div>
                </div>
            </div>
        </div>

        <div class="row">
            <div class="card">
                <div class="card-header">
                    <h5>Large Files (>50MB)</h5>
                </div>
                <div class="card-body">
                    <div class="table-responsive">
                        <table class="table table-striped" id="largeFilesTable">
                            <thead>
                                <tr>
                                    <th>Path</th>
                                    <th>Size</th>
                                    <th>Owner</th>
                                    <th>Date</th>
                                </tr>
                            </thead>
                            <tbody>
                                <!-- Will be populated with JavaScript -->
                            </tbody>
                        </table>
                    </div>
                </div>
            </div>
        </div>
    </div>

    <script src="https://cdn.jsdelivr.net/npm/bootstrap@5.3.3/dist/js/bootstrap.bundle.min.js" integrity="sha384-YvpcrYf0tY3lHB60NNkmXc5s9fDVZLESaAA55NDzOxhy9GkcIdslK1eN7N6jIeHz" crossorigin="anonymous"></script>
    <script src="https://cdn.jsdelivr.net/npm/chart.js"></script>
    <script src="/static/js/dashboard.js"></script>
</body>
</html>
We will use Chart.js to build nice looking charts. This JS code will fetch the data from the API and hydrate the charts in the template.
dashboard.js
initialise the charts
//static/js/dashboard.js

// Chart objects
let diskSpaceChart, inodeChart, diskIOChart;

function initCharts() {
    // Disk Space Chart
    const diskSpaceCtx = document.getElementById('diskSpaceChart').getContext('2d');
    diskSpaceChart = new Chart(diskSpaceCtx, {
        type: 'bar',
        data: {
            labels: [],
            datasets: [{
                label: 'Used Space (%)',
                data: [],
                backgroundColor: 'rgba(54, 162, 235, 0.6)'
            }]
        },
        options: {
            scales: {
                y: {
                    beginAtZero: true,
                    max: 100
                }
            }
        }
    });

    // Inode Chart
    const inodeCtx = document.getElementById('inodeChart').getContext('2d');
    inodeChart = new Chart(inodeCtx, {
        type: 'bar',
        data: {
            labels: [],
            datasets: [{
                label: 'Used Inodes (%)',
                data: [],
                backgroundColor: 'rgba(255, 99, 132, 0.6)'
            }]
        },
        options: {
            scales: {
                y: {
                    beginAtZero: true,
                    max: 100
                }
            }
        }
    });

    // Disk I/O Chart
    const diskIOCtx = document.getElementById('diskIOChart').getContext('2d');
    diskIOChart = new Chart(diskIOCtx, {
        type: 'bar',
        data: {
            labels: [],
            datasets: [
                {
                    label: 'Read Rate (KB/s)',
                    data: [],
                    backgroundColor: 'rgba(54, 162, 235, 0.6)'
                },
                {
                    label: 'Write Rate (KB/s)',
                    data: [],
                    backgroundColor: 'rgba(255, 99, 132, 0.6)'
                }
            ]
        }
    });
}
Update the refresh date
function updateLastUpdatedTime(locale = navigator.language) {
    const now = new Date();
    const options = {
        year: 'numeric',
        month: 'short',
        day: 'numeric',
        hour: '2-digit',
        minute: '2-digit',
        second: '2-digit'
    };

    const formattedTime = now.toLocaleString(locale, options);
    document.getElementById('lastUpdated').textContent = `Last updated: ${formattedTime}`;
}
Call the API and hydrate the charts and table
async function fetchData() {
    try {
        updateLastUpdatedTime();

        // Fetch disk space data
        const diskSpaceResponse = await fetch('/api/disk-space');
        const diskSpaceData = await diskSpaceResponse.json();

        // Update disk space chart
        diskSpaceChart.data.labels = diskSpaceData.map(item => item.mounted_on);
        diskSpaceChart.data.datasets[0].data = diskSpaceData.map(item =>
            parseFloat(item.use_percent.replace('%', '')));
        diskSpaceChart.update();

        // Fetch inode data
        const inodeResponse = await fetch('/api/inodes');
        const inodeData = await inodeResponse.json();

        // Update inode chart
        inodeChart.data.labels = inodeData.map(item => item.mounted_on);
        inodeChart.data.datasets[0].data = inodeData.map(item =>
            parseFloat(item.iuse_percent.replace('%', '')));
        inodeChart.update();

        // Fetch large files data
        const largeFilesResponse = await fetch('/api/large-files');
        const largeFilesData = await largeFilesResponse.json();

        // Update large files table
        const tableBody = document.getElementById('largeFilesTable').getElementsByTagName('tbody')[0];
        tableBody.innerHTML = '';

        largeFilesData.forEach(file => {
            const row = tableBody.insertRow();
            row.insertCell(0).textContent = file.path;
            row.insertCell(1).textContent = file.size;
            row.insertCell(2).textContent = file.owner;
            row.insertCell(3).textContent = file.date;
        });

        // Fetch disk I/O data
        try {
            const diskIOResponse = await fetch('/api/disk-io');

            if (!diskIOResponse.ok) {
                throw new Error(`Server returned ${diskIOResponse.status}: ${diskIOResponse.statusText}`);
            }

            const diskIOData = await diskIOResponse.json();

            if (diskIOData.length > 0) {
                document.getElementById('diskIOChart').style.display = 'block';
                const chartContainer = document.getElementById('diskIOChart').parentNode;
                const errorDiv = chartContainer.querySelector('.alert');
                if (errorDiv) {
                    chartContainer.removeChild(errorDiv);
                }

                const filteredDevices = diskIOData.filter(item => !item.device.startsWith('loop'));
                diskIOChart.data.labels = filteredDevices.map(item => item.device);

                const readRates = filteredDevices.map(item => parseFloat(item.r_s) || 0);
                const writeRates = filteredDevices.map(item => parseFloat(item.w_s) || 0);
                diskIOChart.data.datasets[0].data = readRates;
                diskIOChart.data.datasets[1].data = writeRates;

                diskIOChart.update();
            } else {
                const diskIOCtx = document.getElementById('diskIOChart');
                diskIOCtx.style.display = 'none';

                const chartContainer = diskIOCtx.parentNode;
                let errorDiv = chartContainer.querySelector('.alert');
                if (!errorDiv) {
                    errorDiv = document.createElement('div');
                    errorDiv.className = 'alert alert-warning mt-3';
                    chartContainer.appendChild(errorDiv);
                }
                errorDiv.textContent = 'No I/O statistics available.';
            }
        } catch (ioError) {
            console.error('Error fetching disk I/O data:', ioError);
            const diskIOCtx = document.getElementById('diskIOChart');
            diskIOCtx.style.display = 'none';

            const chartContainer = diskIOCtx.parentNode;
            let errorDiv = chartContainer.querySelector('.alert');
            if (!errorDiv) {
                errorDiv = document.createElement('div');
                errorDiv.className = 'alert alert-danger mt-3';
                chartContainer.appendChild(errorDiv);
            }
            errorDiv.textContent = `Error fetching I/O data: ${ioError.message}`;
        }

    } catch (error) {
        console.error('Error fetching data:', error);
    }
}
Starting and Updating the Dashboard
document.addEventListener('DOMContentLoaded', () => {
    initCharts();
    updateLastUpdatedTime();
    fetchData();

    document.getElementById('refreshBtn').addEventListener('click', () => {
        fetchData();
    });

    // Auto-refresh every 300 seconds
    setInterval(fetchData, 60000);
});
Testing with pytest
This is a very basic test suite to get started. It is mocking the API responses. You do not have to test here to make this work but it is a really good practice to build your tests along the way. Test-Driven-Development (TDD for friends) is not mandatory though encouraged, but that is another topic/debate I don't want to start here. The most important is to have a regression test suite so you can make changes without the fear of breaking things.
# test_app.py
from fastapi.testclient import TestClient
from unittest.mock import patch
from dashboard.main import app, DiskSpace, InodeUsage, LargeFile, DiskIO

client = TestClient(app)

def mock_ssh_response(command):
    """Returns mock responses for different commands."""
    if 'df -h' in command:
        return """Filesystem      Size  Used Avail Use% Mounted on
/dev/sda1        30G   15G   14G  52% /
/dev/sda2       434G  144G  268G  35% /home
tmpfs           7.8G     0  7.8G   0% /tmp"""
    elif 'df -i' in command:
        return """Filesystem       Inodes  IUsed   IFree IUse% Mounted on
/dev/sda1      3932160 532967 3399193   14% /
/dev/sda2     58007552 874332 57133220    2% /home"""
    elif 'du -h' in command:
        return """12M   /var/backups
24K   /var/tmp
1.2G  /var/log
4.0K  /var/mail
132M  /var/cache
1.3G  /var"""
    elif 'find' in command:
        return """-rw-r--r-- 1 user user 500M Apr 10 12:34 /home/user/database.dump
-rw-r--r-- 1 user user 350M Apr  9 09:12 /home/user/backup.tar.gz"""
    elif 'iostat' in command:
        return """Device            r/s     w/s     rkB/s     wkB/s   rrqm/s   wrqm/s  %rrqm  %wrqm r_await w_await aqu-sz rareq-sz wareq-sz  svctm  %util
sda              0.42    2.50      5.60     42.50     0.00     1.00   0.00  28.57    1.50    2.50   0.01    13.33    17.00   0.50   0.15"""

@patch('dashboard.main.ssh_execute')
def test_disk_space_endpoint(mock_ssh):
    # Set up the mock to return our test data
    mock_ssh.return_value = mock_ssh_response('df -h')

    # Make the request
    response = client.get('/api/disk-space')

    # Check response
    assert response.status_code == 200
    data = response.json()

    disk_spaces = [DiskSpace(**item) for item in data]

    # Verify model fields
    assert disk_spaces[0].filesystem == '/dev/sda1'
    assert disk_spaces[0].size == '30G'
    assert disk_spaces[0].used == '15G'
    assert disk_spaces[0].available == '14G'
    assert disk_spaces[0].use_percent == '52%'
    assert disk_spaces[0].mounted_on == '/'


@patch('dashboard.main.ssh_execute')
def test_inodes_endpoint(mock_ssh):
    mock_ssh.return_value = mock_ssh_response('df -i')
    response = client.get('/api/inodes')
    assert response.status_code == 200
    data = response.json()
    assert len(data) == 2
    inode_usages = [InodeUsage(**item) for item in data]
    assert inode_usages[0].filesystem == '/dev/sda1'
    assert inode_usages[0].inodes == '3932160'
    assert inode_usages[0].iused == '532967'
    assert inode_usages[0].ifree == '3399193'
    assert inode_usages[0].iuse_percent == '14%'
    assert inode_usages[0].mounted_on == '/'

@patch('dashboard.main.ssh_execute')
def test_large_files_endpoint(mock_ssh):
    mock_ssh.return_value = mock_ssh_response('find')
    response = client.get('/api/large-files')
    assert response.status_code == 200
    data = response.json()
    large_files = [LargeFile(**item) for item in data]
    assert large_files[0].permissions == '-rw-r--r--'
    assert large_files[0].owner == 'user'
    assert large_files[0].group == 'user'
    assert large_files[0].size == '500M'
    assert large_files[0].date == 'Apr 10 12:34'
    assert '/database.dump' in large_files[0].path

@patch('dashboard.main.ssh_execute')
def test_disk_io_endpoint(mock_ssh):
    mock_ssh.return_value = mock_ssh_response('iostat')
    response = client.get('/api/disk-io')
    assert response.status_code == 200
    data = response.json()
    disk_io_stats = [DiskIO(**item) for item in data]

    assert disk_io_stats[0].device == 'sda'
    assert hasattr(disk_io_stats[0], 'r_s')
    assert hasattr(disk_io_stats[0], 'w_s')

    # The model allows extra fields due to Config(extra="allow")
    # But we can still test that certain fields are present and valid
    assert float(disk_io_stats[0].r_s) >= 0
    assert float(disk_io_stats[0].w_s) >= 0
Running the Application
Different ways to run the app, either with fastapi or uvicorn or python commands. I use the fastapi for nicer look:
# Run the web server with fastapi command line:
cd dashboard
fastapi dev
To run the tests
pytest
Access the dashboard at http://localhost:8000 in your web browser.
You can also access the automatically generated API documentation at:
- http://localhost:8000/docs - Swagger UI documentation
- http://localhost:8000/redoc - ReDoc documentation
This is one of the great advantages of FastAPI - it automatically generates interactive API documentation.
Congratulations! You have just built a disk space monitoring dashboard that could save your system from a meltdown. Before dreaming bigger, let’s talk security for production use.
Security Considerations
This dashboard is designed for simplicity, making it best suited for local use and ideal for learning, but deploying it in production requires significant security enhancements.
For a robust production setup, pair it with nginx as a reverse proxy, implement user authentication and role-based access control using FastAPI’s security dependencies, and enforce SSH key-based authentication with dedicated, limited-permission monitoring accounts and key rotation policies.
Strengthen API and client security by adding rate limiting, request validation to prevent injection attacks, HTTPS with proper certificates, and improved error handling.
For credential management, avoid hard-coding credentials, opting instead for environment variables or secure storage like secrets management solutions.
If monitoring multiple servers, consider a production architecture with a dedicated agent pushing metrics to a central server, a message queue for asynchronous processing, and redundancy to ensure reliability.
Development Methodology
This project used a practical approach to using AI assistance in development while maintaining good practices.
AI-Assisted Development
AI: Helper, Not Hero
I used Claude.ai to generate the initial scaffolding for this project, which provided several benefits: - Rapid prototyping of the basic structure - Suggestions for library choices and implementation approaches - Quick generation of boilerplate code
However, the result was "meh" to be clear: - The AI-generated code appeared coherent but lacked cohesion between components - Some generated tests didn't properly verify the actual implementation - The project structure needed realignment to follow best practices - That said, Claude was helpful for the JS parts, a bit too verbose but easily corrected.
Lessons Learned
An application as simple as this one already requires a lot of attention to details. Unless you know what these details are, you cannot be blindly following an AI to get your application running in the wild. Multiple examples of "Vibe coding" (I am not found of this term) are popping up and they are crushed as soon as in production, learning the hard way.
This approach taught me several important lessons about AI-assisted development:
- AI tools are ok for generating boilerplate and some standard patterns (sometimes using old paradigms though)
- Developer expertise remains essential for system design and integration (which is reassuring)
- Critical evaluation of generated code is necessary
- AI is most valuable only when paired with strong software engineering fundamentals
AI is not going to eradicate developers. We need more educated developers, more mathematicians, more business matter experts. AI is a tool that can remove the boring stuff.
Conclusion
By combining the power of Linux commands with a web interface, you can create a powerful monitoring solution tailored to your needs.
However, this is a relatively naive approach to get the data, not really efficient nor secure as we have constant ssh connections.
Your homework
You can try refactoring the code and expand the solution.
- Build a SSH Manager that would do all the commands in one call for example.
- Add more than one server
- Compare to existing commercial products to see how they designed their solutions.
Key Takeaways
- FastAPI provides a powerful, modern framework for building APIs quickly
- Paramiko enables secure SSH automation from Python
- Chart.js offers flexible data visualization options
- A monitoring solution doesn't need to be complex to provide value
The goal of this learning exercise was to showcase how simple it is to build a basic solution based upon a previous article I wrote about linux commands.
If you consider a production ready level though, it can become very complex so buckle up and never give up. Keep learning!